
製品説明
tdTomatoは非常に明るい赤色蛍光タンパク質であり、EGFPの2.5倍の蛍光強度を示す。tdTomatoは、dTomato(dimeric Tomato)遺伝子2つをタンデムにつなぎ合わせ、タンデム2量体を形成するよう設計されている。これにより非常に明るい蛍光シグナルが得られ、しかも凝集性は極めて低く抑えられている(1)。この蛍光強度と581 nmの蛍光極大波長を持つため、動物個体でのイメージング解析に理想的であり、マウスへ移植した肺がん細胞の転移を調べた例では表皮から1 cmの深度まで蛍光が検出されている(2)。
また、tdTomatoは分子内二量体構造をとるため、単量体のような物理的特性を示すことが分かっており、N-、C-末端融合タンパク質の作製にも適している(3)。プロモーターアッセイでのレポーターとしての使用報告もある(4)。
tdTomatoの検出にはLiving Colors DsRed Monoclonal Antibody(製品コード 632392)、Living Colors DsRed Polyclonal Antibody(製品コード 632496)が利用可能である。
また、tdTomatoは分子内二量体構造をとるため、単量体のような物理的特性を示すことが分かっており、N-、C-末端融合タンパク質の作製にも適している(3)。プロモーターアッセイでのレポーターとしての使用報告もある(4)。
tdTomatoの検出にはLiving Colors DsRed Monoclonal Antibody(製品コード 632392)、Living Colors DsRed Polyclonal Antibody(製品コード 632496)が利用可能である。
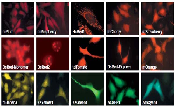
蛍光タンパク質の特性
| 蛍光タンパク質 | 色調 | 励起極大波長 (nm) |
蛍光極大波長 (nm) |
構造 | 量子収率*a | モル吸光係数 (M-1cm-1)*b |
蛍光強度*c | 推奨フィルターセット*d |
|---|---|---|---|---|---|---|---|---|
| tdTomato | red | 554 | 581 | タンデム2量体 | 0.69 | 138,000 | 95,220 | C.T. 41002c & 42005 |
*a : Unless otherwise specified (see footnotes f and g), the Relative Quantum Yield of each fluorescent protein (QFP) was determined using the following equation : QFP = (Qfluo* FFP* ODfluo) / (Ffluo* ODFP), where F is the fluorescence and OD is the optical density of either the fluorescent protein (FP) or the reference fluorophore (fluo).
*b : Unless otherwise specified (see footnotes f and g), the Molar Extinction Coefficient (ε) for each protein was determined as follows: A = εcl (Beer-Lambert law) or ε = A/c, where A = absorbance, c = concentration (determined by the Bradford Protein Assay), l = path length (1 cm). Each molar extinction coefficient was determined at the absorption maxima of its respective protein.
*c : Brightness = (Quantum Yield) (Extinction Coefficient)
*d : C.T.= Chroma Technologies
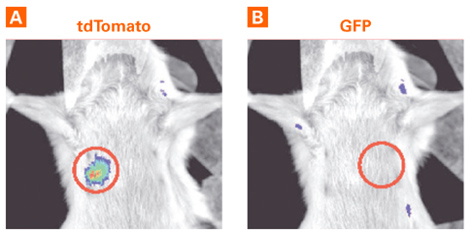
図1. SCIDマウスモデルでのtdTomatoおよびGFPの蛍光検出
疑似色オーバーレイ画像(False-color overlay images;目的の領域を丸で囲んでいる)より、イメージングシステムはマウスモデルの中のtdTomatoの蛍光を検出できたが、GFPの蛍光を検出できなかった。
パネルA.100×106個のMDA-MB-231-tdTomato発現細胞を含むチューブを移植し、DsRedフィルターセットを用いてイメージングして得た画像。露光時間:1秒。
パネルB.100×106個のMDA-MB-231-GFP発現細胞を含むチューブを移植し、GFPフィルターセットを用いてイメージングして得た画像。露光時間:1秒。
図2. tdTomato蛍光タンパク質融合ベクターのベクターマップ(哺乳類細胞用)
左:N末端融合蛍光タンパク質ベクター、右:C末端融合蛍光タンパク質ベクター
図3. tdTomato蛍光タンパク質のベクターマップ(細菌用)
大腸菌発現ベクターは、蛍光タンパク質遺伝子の供給源としても利用できる。なお3' MCSの5'側に停止コドンがあるため、3' MCSは融合タンパク質の作製には使用できない。
保存
-20℃


- 注意事項
- 本ページの製品はすべて研究用として販売しております。ヒト、動物への医療、臨床診断用には使用しないようご注意ください。また、食品、化粧品、家庭用品等として使用しないでください。
- タカラバイオの承認を得ずに製品の再販・譲渡、再販・譲渡のための改変、商用製品の製造に使用することは禁止されています。
- タカラバイオ製品に関連するライセンス・パテントについては、ライセンスマークをクリックして内容をご確認ください。
また、他メーカーの製品に関するライセンス・パテントについては、各メーカーのウェブサイトまたはメーカー発行のカタログ等でご確認ください。 - ウェブサイトに掲載している会社名および商品名などは、各社の商号、または登録済みもしくは未登録の商標であり、これらは各所有者に帰属します。